Service Line Opportunity Inpatient
Overview
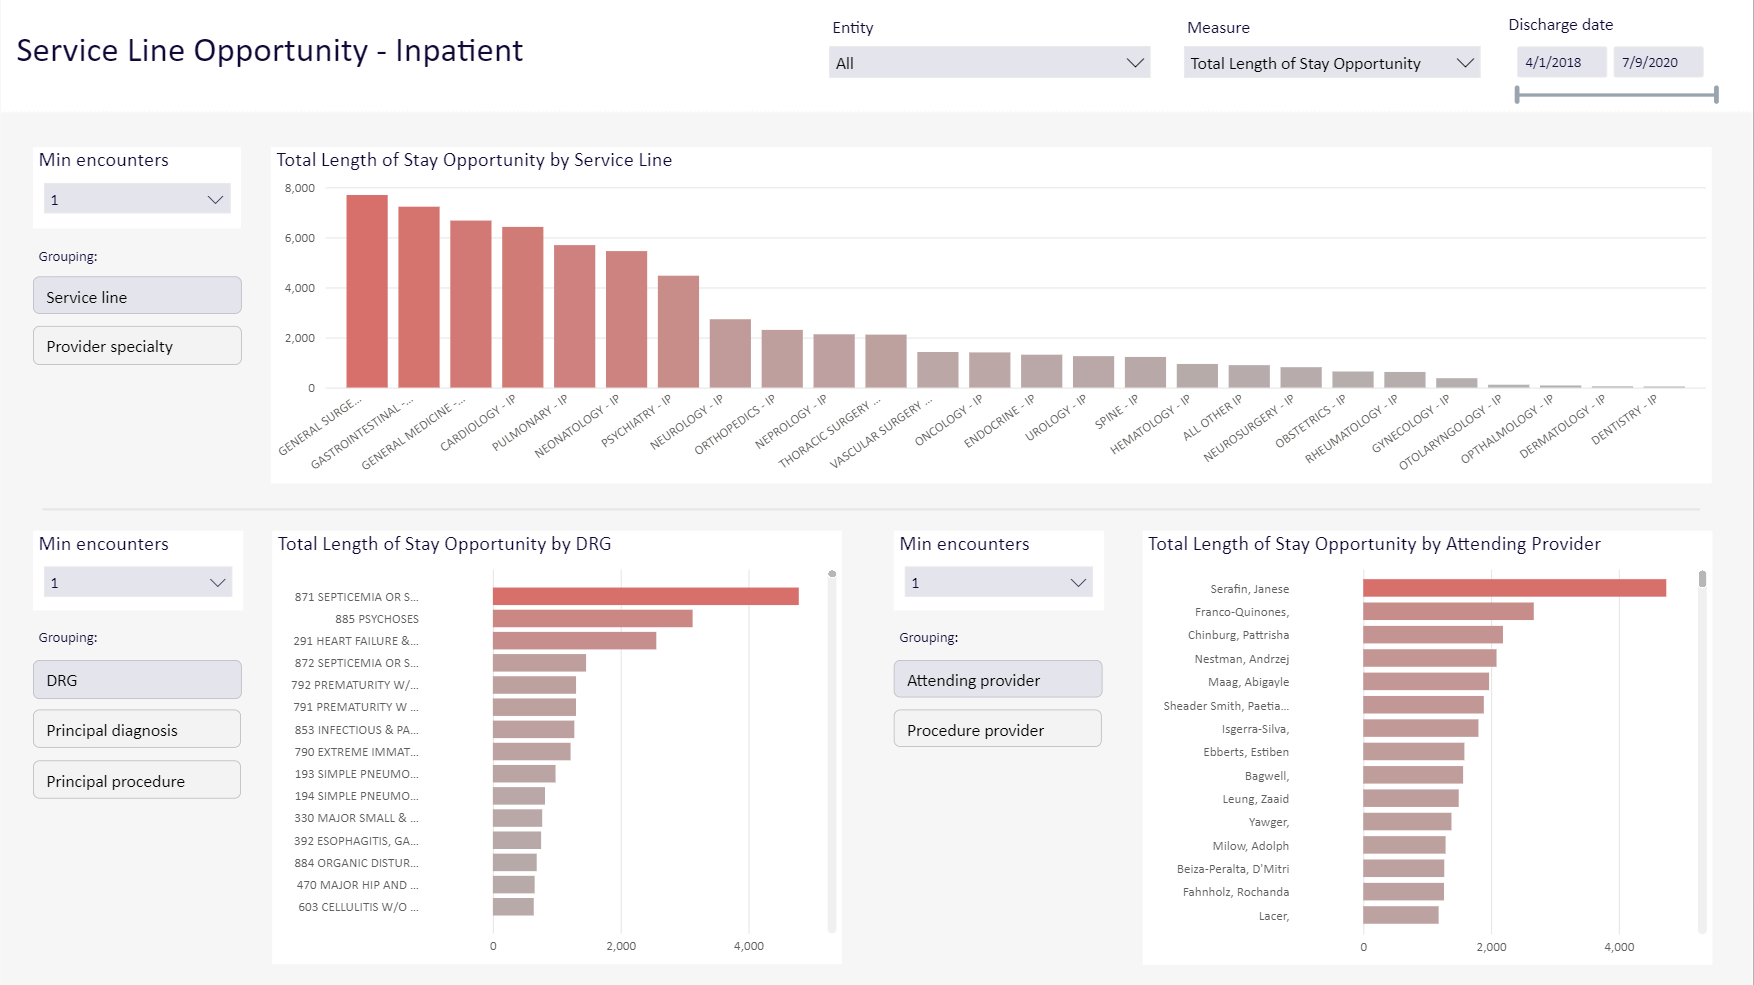
Use the Service Line Opportunity - Inpatient report to analyze length of stay opportunities by several factors, each with specialized groupings. With these options, you can focus on the exact view of the data you require.
Click image to view full size
Slicers
This report provides filtering options that let you create a set of data, giving you the option of viewing the precise data you want to view.
Entity
The entity drop-down lists all of the clinics, hospitals, and other entities that comprise your institution. You can choose to view all of those entities or select a single entity to view.
Measure
This drop-down let you select either Total Cost Opportunity or Total Length of Stay Opportunity as the basis for the report.
Discharge date
Use this control to specify the date range for the report. You can use the slider or, for a precise setting, click in each date box to choose dates from a calendar.
TIP: Use the dashboard tools to view, export, and sort the data; view data as table; and more.
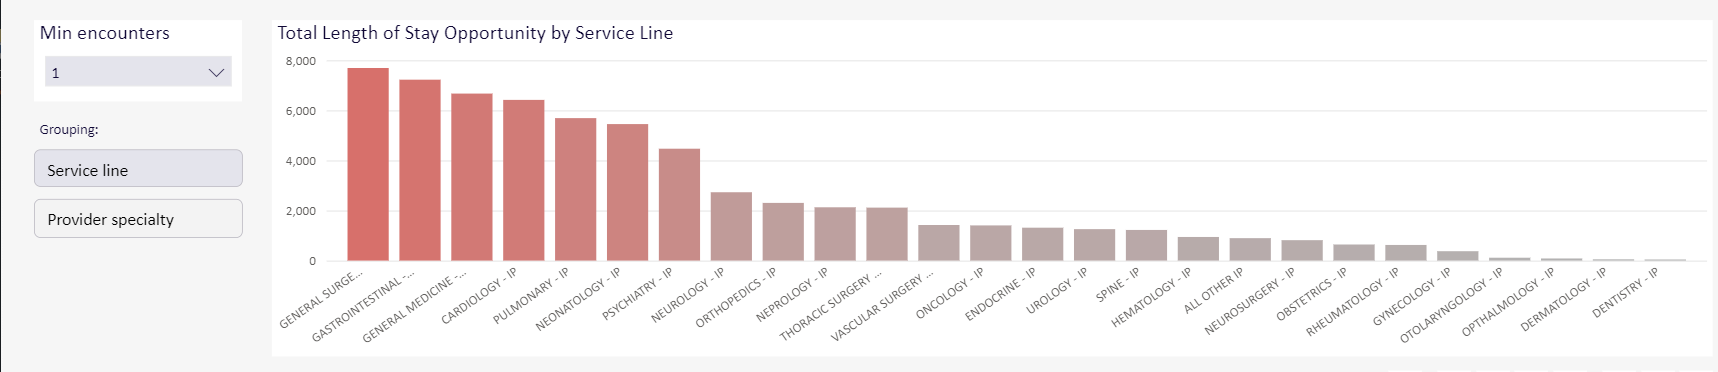
Total Length of Stay Opportunity by Service Line
Use this bar chart to view data grouped by Service line or Provider specialty. You can also change the minimum number of encounters for your view of the data.
Click image to view full size
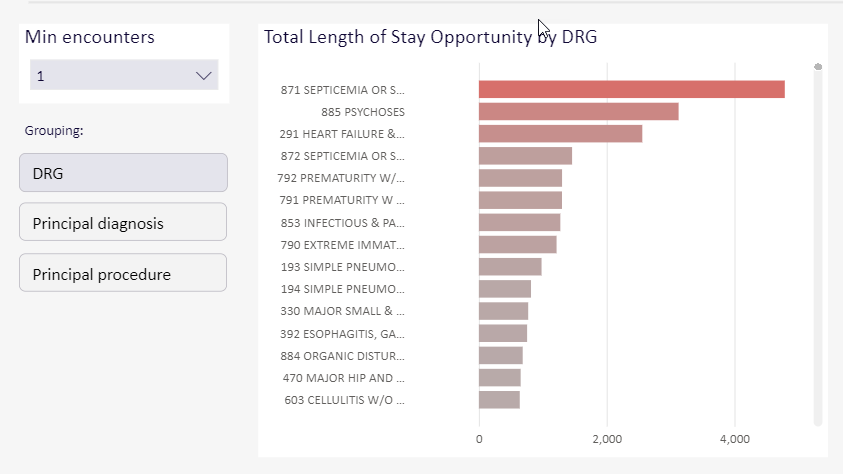
Total Length of Stay Opportunity by DRG
Use this chart to view data grouped by DRG, Principal Diagnosis, or Principal procedure. You can also change the minimum number of encounters for your view of the data.
Click image to view full size
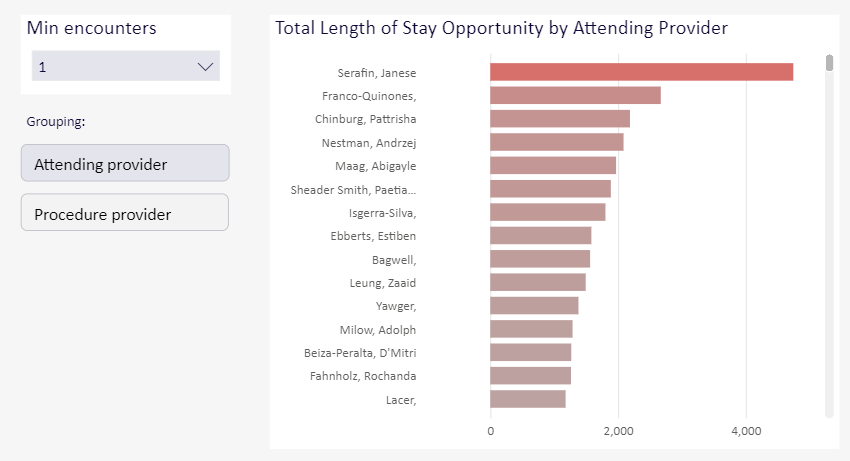
Total Length of Stay Opportunity by Attending Provider
Use this chart to view data grouped by Attending provider or Procedure provider. You can also change the minimum number of encounters for your view of the data.
Click image to view full size
Navigation
-
Use the tabs at the bottom of the page to view other related reports in the category
-
Use the Navigation menu in the upper-left corner to return to Recent places that you've visited or to the Intelligence Center.